

Cryptocurrency charts can be daunting for beginners, but with our in-depth tutorial, we will demystify the complexities and empower you to navigate the crypto market confidently.
Master how to read crypto charts with our guide! Decode candlestick language for market trends. Identify movements, Trade confidently. Your key to crypto success
Table of Contents
- Basics of Crypto Charts
- Advanced Technical Analysis Techniques
- Real-time Analysis and Practical Tips
- Risk Management and Strategy Implementation
- Conclusion
- FAQs
- What are candlestick charts, and why are they essential for analyzing cryptocurrency markets?
- How can support and resistance levels be identified on a crypto chart, and why are they crucial for technical analysis?
- What is the significance of moving averages in crypto chart analysis, and how do they contribute to understanding market trends?
- How does the Relative Strength Index (RSI) help gauge market momentum, and why is it important for traders?
- Why is risk management important in crypto trading, and how can traders effectively set stop-loss and take-profit levels?
Basics of Crypto Charts
Candlestick Charts
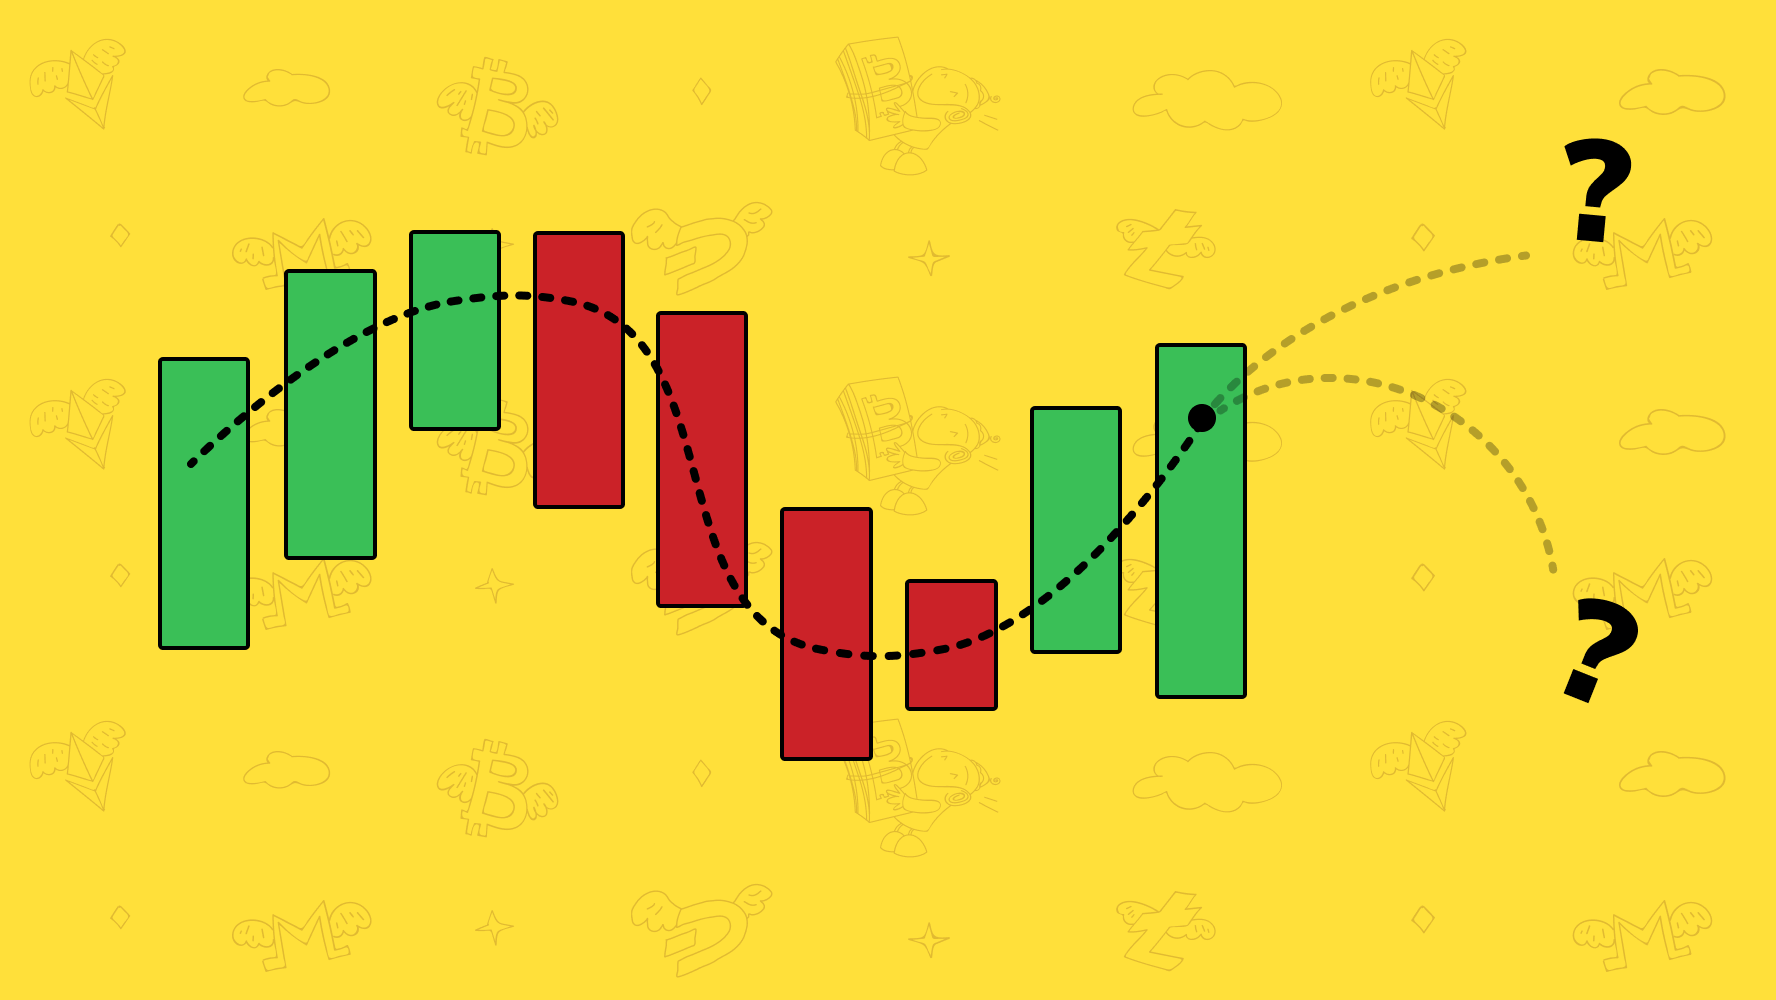
Understanding candlestick charts is crucial for navigating the complex landscape of cryptocurrency trading. Each candlestick, representing a specific time frame, provides a snapshot of market dynamics. The open and close prices are depicted by the candle’s body, while the high and low prices are represented by its wicks. This visual representation equips traders with the ability to discern market sentiment, identify potential reversals, and formulate strategic entry and exit points.
Trend Analysis
In the dynamic and often unpredictable realm of cryptocurrencies, trend analysis serves as a compass for traders. Recognizing different trends, such as bullish (upward) or bearish (downward), empowers you to align your strategies with the prevailing market sentiment. By delving into the intricacies of trend analysis, traders can anticipate potential price movements, enabling well-informed decision-making and maximizing profit opportunities.
Advanced Technical Analysis Techniques
Support and Resistance: Pillars of Crypto Chart Analysis
Support and resistance levels act as crucial pillars in technical analysis. We detail how to identify these levels on a crypto chart, empowering you to predict potential price movements and make strategic trading decisions.
Moving Averages: Unveiling Market Trends
We explore the significance of moving averages in understanding market trends. Whether it’s the simple moving average (SMA) or the exponential moving average (EMA), we break down their applications, ensuring you leverage these tools effectively.
Relative Strength Index (RSI): Gauging Market Momentum
Understanding market momentum is pivotal for successful trading. We dissect the RSI, a powerful indicator that helps you assess whether a cryptocurrency is overbought or oversold, providing insights into potential trend reversals.
Real-time Analysis and Practical Tips
Utilizing TradingView for Dynamic Analysis
To equip you with real-time insights, we introduce TradingView, a powerful charting platform. Discover how to customize charts, add indicators, and implement drawing tools, maximizing your ability to analyze crypto charts on the fly.
Practical Tips for Effective Analysis
In the fast-paced world of crypto trading, time is of the essence. We share practical tips on streamlining your analysis process, from setting up alerts for key price levels to staying updated on market news that may impact your trades.
Risk Management and Strategy Implementation
Setting Stop-Loss and Take-Profit Levels
Risk management is non-negotiable in crypto trading. We guide you through setting appropriate stop-loss and take-profit levels, ensuring you protect your investments and optimize profit potential.
Developing Your Trading Strategy
A successful crypto trader is not only adept at analysis but also strategic in execution. We provide insights into developing a personalized trading strategy, aligning your approach with your risk tolerance and financial goals.
Conclusion
In this comprehensive guide, we have delved into the intricacies of reading and analyzing crypto charts. Armed with the knowledge gained, you are now better equipped to navigate the dynamic world of cryptocurrency trading.
FAQs
What are candlestick charts, and why are they essential for analyzing cryptocurrency markets?
Candlestick charts visually represent price movements over time, displaying open, Close, high, and low prices. Understanding these charts is fundamental for decoding market trends and making informed trading decisions.
How can support and resistance levels be identified on a crypto chart, and why are they crucial for technical analysis?
Support and resistance levels are identified based on historical price data. Recognizing these levels is vital as they act as key reference points, helping traders predict potential price movements and formulate effective strategies.
What is the significance of moving averages in crypto chart analysis, and how do they contribute to understanding market trends?
Moving averages, whether simple (SMA) or exponential (EMA), play a pivotal role in revealing market trends. Traders use these averages to smooth out price data and identify the direction of the overall trend, aiding in decision-making.
How does the Relative Strength Index (RSI) help gauge market momentum, and why is it important for traders?
The RSI is an indicator that assesses whether a cryptocurrency is overbought or oversold. Understanding market momentum is crucial for traders to identify potential trend reversals and make well-timed trading decisions.
Why is risk management important in crypto trading, and how can traders effectively set stop-loss and take-profit levels?
Risk management is critical for protecting investments. Traders can set appropriate stop-loss and take-profit levels based on their risk tolerance and profit goals, ensuring a disciplined approach to trading and minimizing potential losses.